
Download the 140 Page Machinery Trends Report
6,453,964
Buyers visited our Marketplace in 2020/21

+3.94%
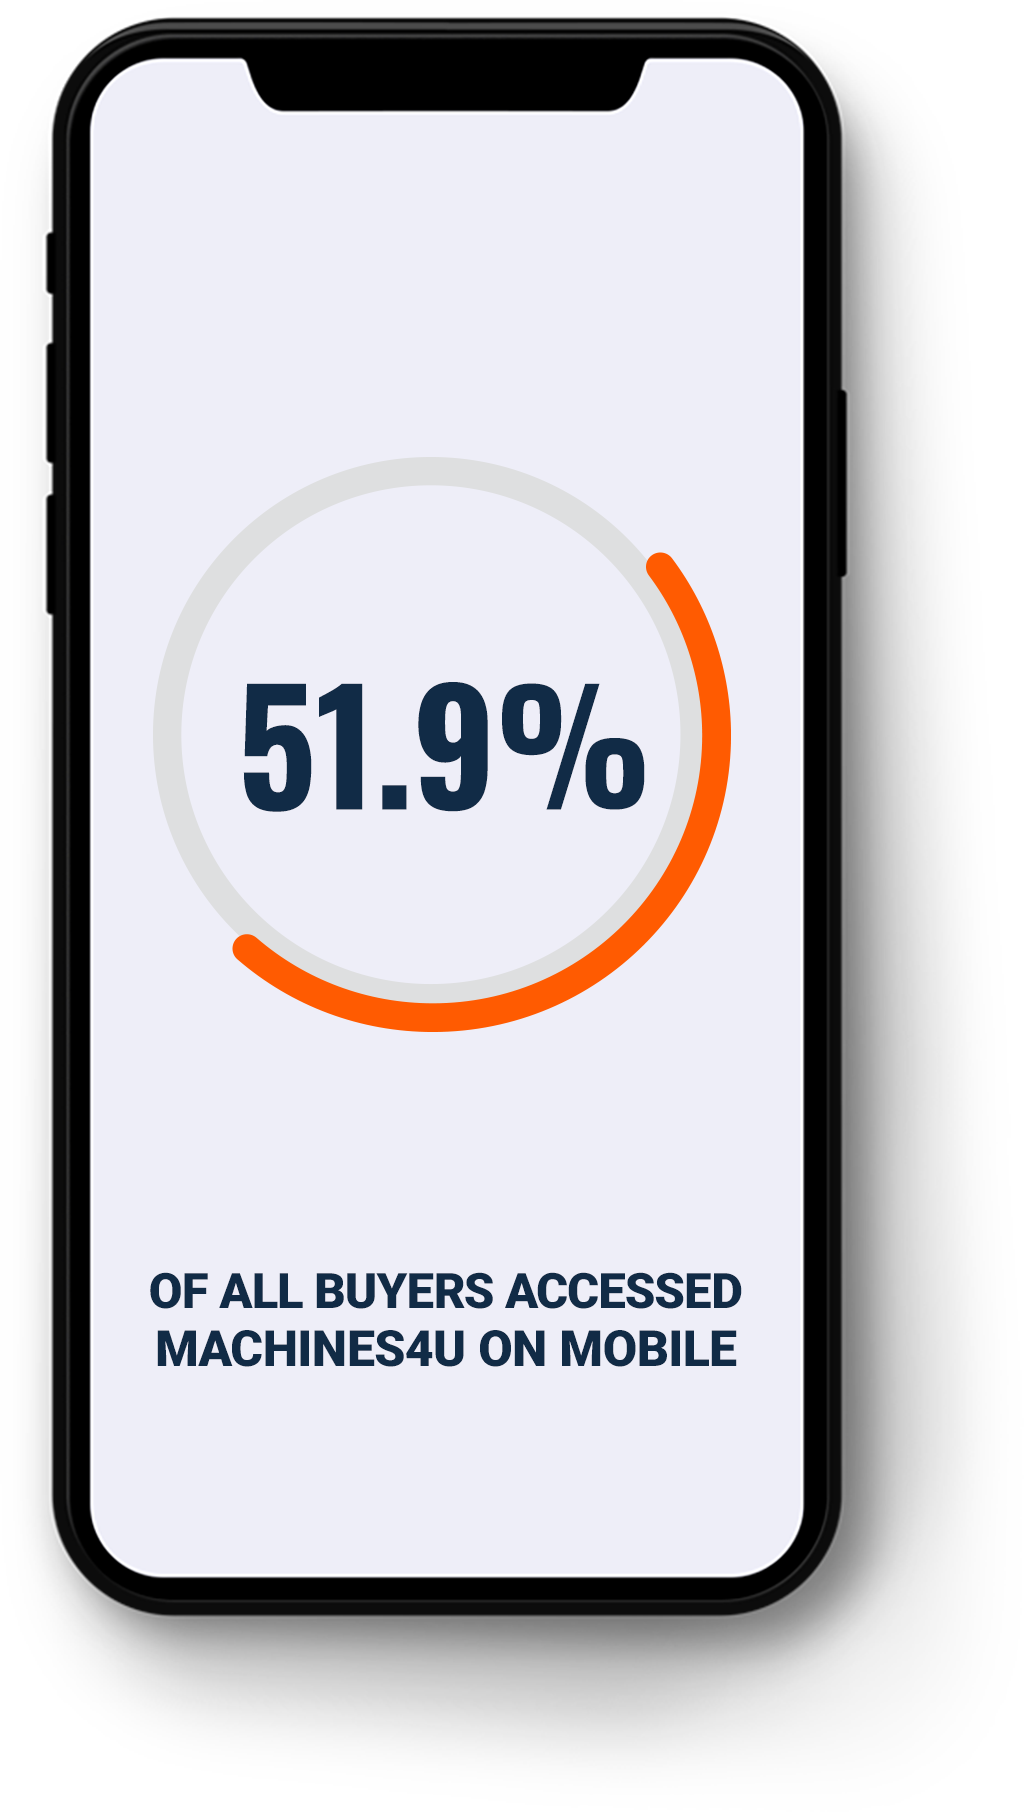
more buyers are searching on mobile than previous year
29.58%
24.46%
28.77%
25.39%
27.96%
20.3%
25.08%
19.26%
Where are they searching from?
Buyers came from all across Australia
137,000
assets listed on the marketplace
What's listing movement been like?
4% More
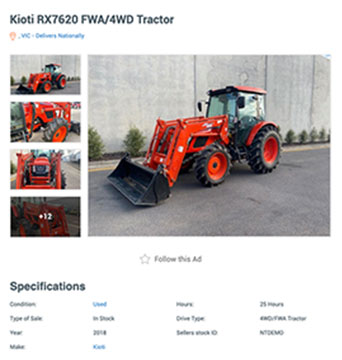
New Tractors since 2018
3% More
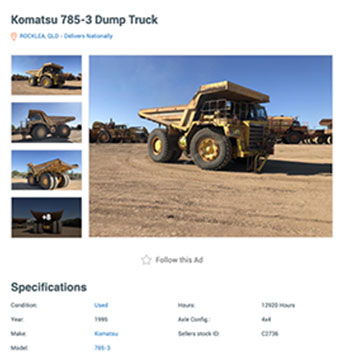
Used Trucks since 2018
20% More
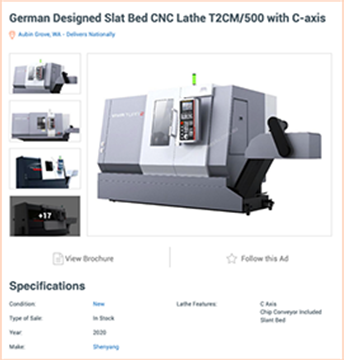
New CNC Lathes since 2018
15% More
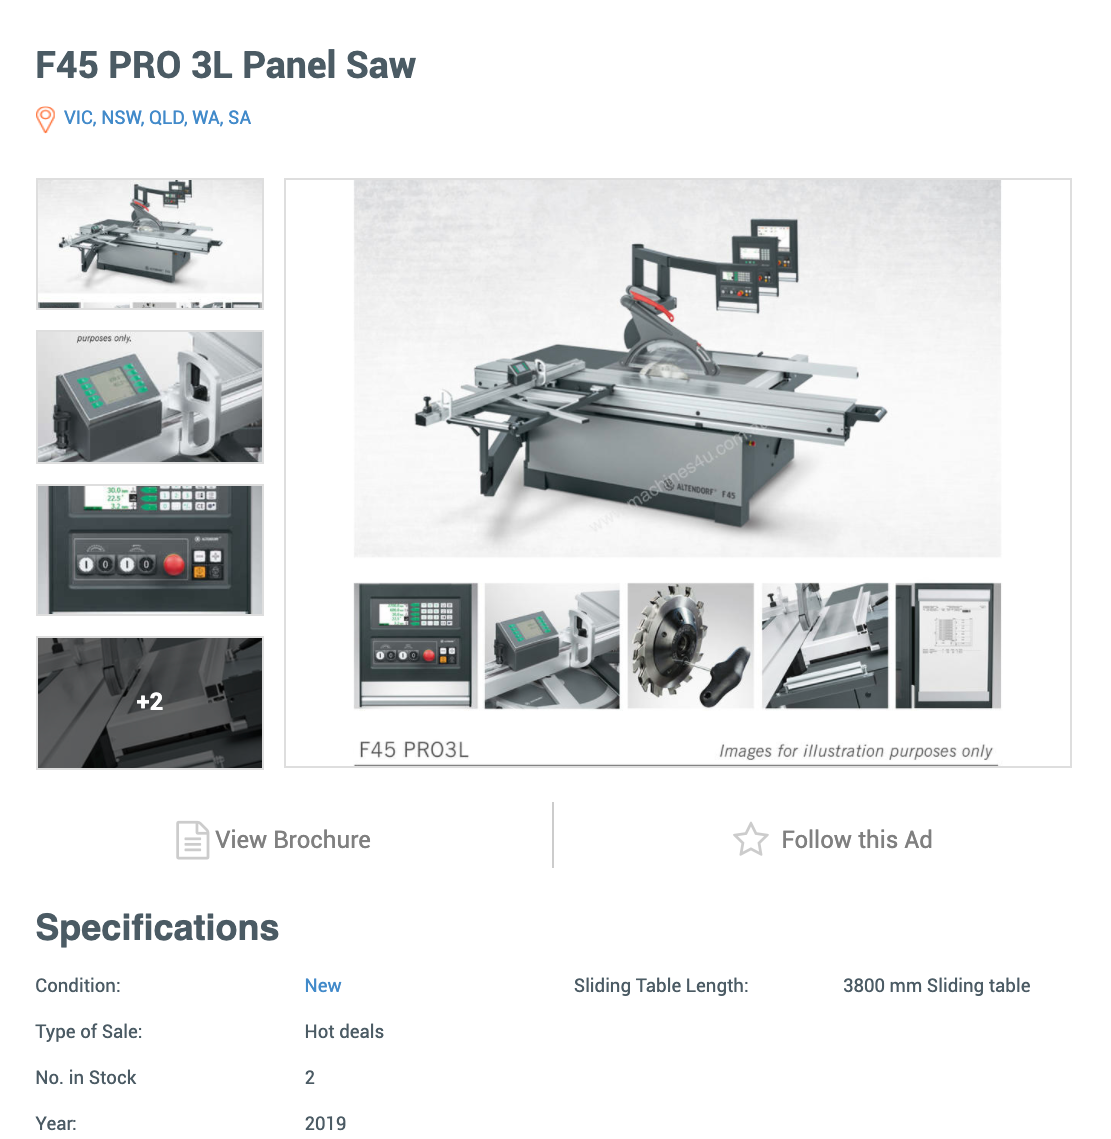
Used Panel Saws since 2018
13% More
New Counterbalance Forklifts since 2018
57% More
New Ovens since 2018
29% More
New Confectionery Machines since 2019
54% More
New Welders since 2018
4% More
New Tractors since 2018
5% More
Air Compressors for hire since 2018
6% More
Scrubbers for hire since 2018
6% More
Generators for hire since 2018
8% More
Workshop Cranes for hire since 2019
9% More
New Handling Cranes since 2018
3% More
Used Trucks since 2018
Download the 140 Page Machinery Trends Report
Construction Industry
Snapshot
Traffic for construction increased Australia-wide by more than
29%
32.51%
29.30%
31.53%
30.84%
26.99%
42.11%
27.92%
25.14%
Shivam's
Construction industry insights
What was the biggest change in buyer behaviour for Construction?
+6.9%
Increase in Email leads
50.7%
57.7%
And an average lead value of
$30,574

More capital equipment industry stats
- 8.83% MORE new condition assets listed on the platform than last year
- 39.81% of all enquiries were submitted after hours
- Organic traffic increased by at least 19% across each State and Territory year-on-year
- State of Industry for our top 5 industries
- Forecasting for our top 5 industries
Metalworking Industry
Snapshot
Traffic for metalworking increased Australia-wide by more than
14%
18.74%
9.64%
15.27%
11.72%
12.57%
1.44%
14.69%
10.11%
Shivam's
Metalworking industry insights
What was the biggest change in buyer behaviour for Metalworking?
+10%
Increase in Email Leads
42.6%
52.6%
And an average lead value of
$20,358

More capital equipment industry stats
- 8.83% MORE new condition assets listed on the platform than last year
- 39.81% of all enquiries were submitted after hours
- Organic traffic increased by at least 19% across each State and Territory year-on-year
- State of Industry for our top 5 industries
- Forecasting for our top 5 industries
Agriculture Industry
Snapshot
Traffic for agriculture increased Australia-wide by more than
48%
47.93%
124.23%
37.77%
51.10%
52.24%
45.40%
45.77%
40.94%
Shivam's
Agriculture industry insights
What was the biggest change in buyer behaviour for Agriculture?
+8.2%
Increase in Email Leads
57.7%
65.9%
And an average lead value of
$62,628

More capital equipment industry stats
- 8.83% MORE new condition assets listed on the platform than last year
- 39.81% of all enquiries were submitted after hours
- Organic traffic increased by at least 19% across each State and Territory year-on-year
- State of Industry for our top 5 industries
- Forecasting for our top 5 industries
Woodworking Industry
Snapshot
Traffic for woodworking increased by more than
7%
3.42%
-2.66%
7.47%
5.27%
7.80%
-7.19%
8.10%
9.82%
Shivam's
Woodworking industry insights
What was the biggest change in buyer behaviour for Woodworking?
+7.6%
Increase in Email Leads
40.5%
48.2%
And an average lead value of
$37,427

More capital equipment industry stats
- 8.83% MORE new condition assets listed on the platform than last year
- 39.81% of all enquiries were submitted after hours
- Organic traffic increased by at least 19% across each State and Territory year-on-year
- State of Industry for our top 5 industries
- Forecasting for our top 5 industries
Trucking Industry
Snapshot
Traffic for trucking increased Australia-wide by more than
69%
74.53%
44.82%
69.99%
74.81%
66.98%
55.54%
69.03%
57.54%
Shivam's
Trucking industry insights
What was the biggest change in buyer behaviour for Trucking?
+11.1%
Increase in Email Leads
56.3%
67.4%
And an average lead value of
$51,974

More capital equipment industry stats
- 8.83% MORE new condition assets listed on the platform than last year
- 39.81% of all enquiries were submitted after hours
- Organic traffic increased by at least 19% across each State and Territory year-on-year
- State of Industry for our top 5 industries
- Forecasting for our top 5 industries
Forklift Industry
Snapshot
Traffic for forklift increased Australia-wide by more than
36%
37.97%
12.13%
38.63%
35.84%
34.83%
48.32%
33.89%
19.31%
Shivam's
Forklift industry insights
What was the biggest change in buyer behaviour for Forklifts?
+6.4%
Increase in Email Leads
50.9%
57.3%
And an average lead value of
$50,869

More capital equipment industry stats
- 8.83% MORE new condition assets listed on the platform than last year
- 39.81% of all enquiries were submitted after hours
- Organic traffic increased by at least 19% across each State and Territory year-on-year
- State of Industry for our top 5 industries
- Forecasting for our top 5 industries
Catering Industry
Snapshot
Traffic for Catering decreased by
-3%
7.06%
-3.58%
2.34%
-8.98%
-4.19%
-17.81%
-5.94%
-6.44%
Shivam's
Catering industry insights
What was the biggest change in buyer behaviour for Catering?
+3.8%
Increase in Email Leads
64.1%
68.0%
And an average lead value of
$42,724

More capital equipment industry stats
- 8.83% MORE new condition assets listed on the platform than last year
- 39.81% of all enquiries were submitted after hours
- Organic traffic increased by at least 19% across each State and Territory year-on-year
- State of Industry for our top 5 industries
- Forecasting for our top 5 industries
Processing Industry
Snapshot
Traffic for processing increased by more than
5%
9.03%
-18.79%
4.40%
1.00%
5.08%
-18.72%
5.35%
-8.41%
Shivam's
Processing industry insights
What was the biggest change in buyer behaviour for Processing?
+6.5%
Increase in Email Leads
57.8%
64.3%
And an average lead value of
$30,967

More capital equipment industry stats
- 8.83% MORE new condition assets listed on the platform than last year
- 39.81% of all enquiries were submitted after hours
- Organic traffic increased by at least 19% across each State and Territory year-on-year
- State of Industry for our top 5 industries
- Forecasting for our top 5 industries
Welding Industry
Snapshot
Traffic for Welding decreased by
-3%
-0.46%
-21.71%
-1.33%
-8.05%
-3.30%
-10.37%
-3.69%
-20.93%
Shivam's
Welding industry insights
What was the biggest change in buyer behaviour for Welding?
+6.2%
Increase in Email Leads
50.3%
56.5%
And an average lead value of
$61,942

More capital equipment industry stats
- 8.83% MORE new condition assets listed on the platform than last year
- 39.81% of all enquiries were submitted after hours
- Organic traffic increased by at least 19% across each State and Territory year-on-year
- State of Industry for our top 5 industries
- Forecasting for our top 5 industries
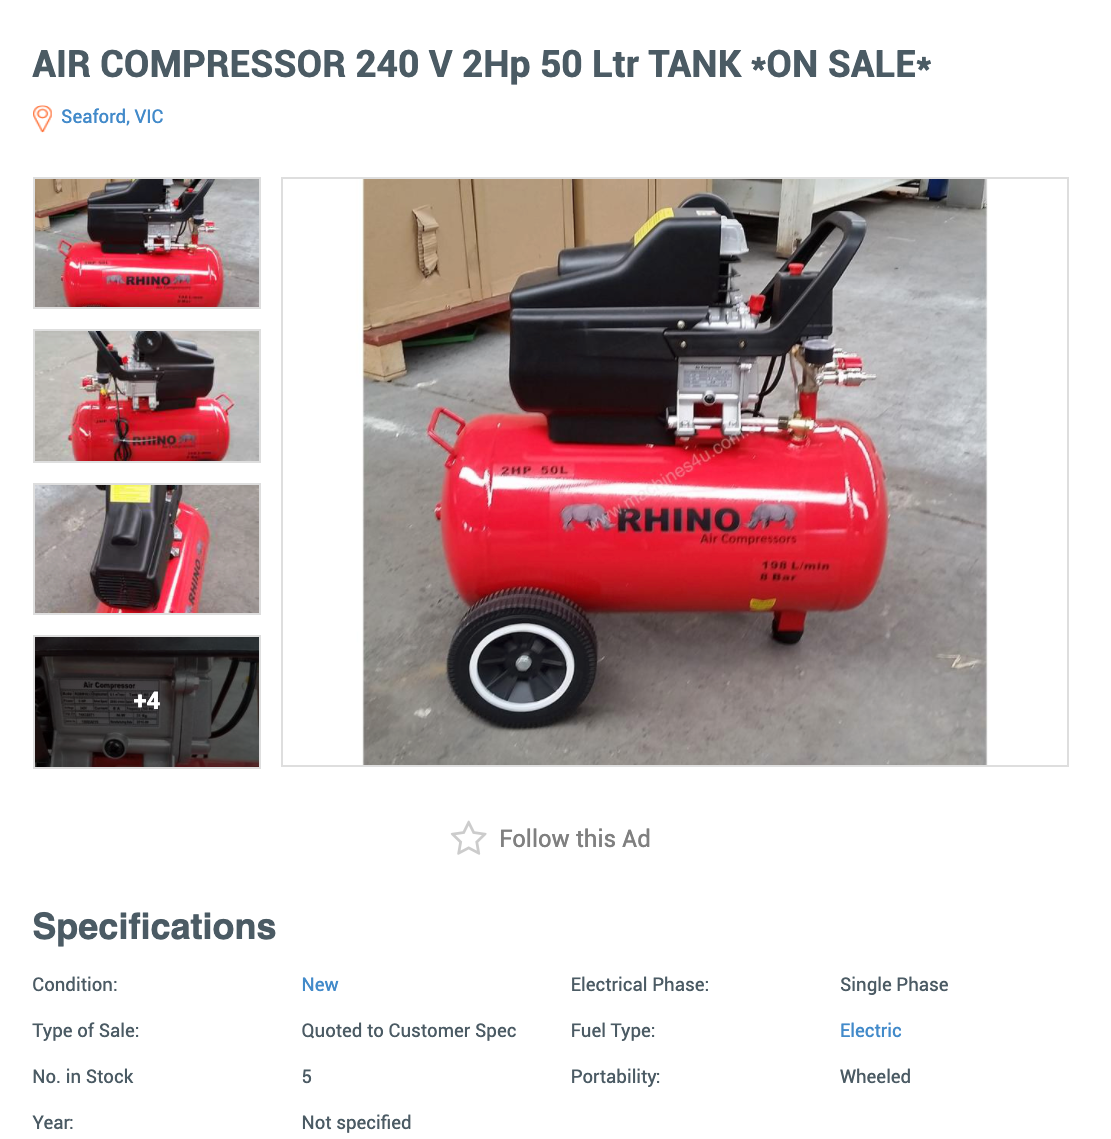
Air Compressors Industry
Snapshot
Traffic for air compressors increased by more than
7%
18.90%
21.35%
7.07%
0.32%
9.78%
25.25%
-0.45%
-0.58%
Shivam's
Air Compressor industry insights
What was the biggest change in buyer behaviour for Air Compressors?
+12.1%
Increase in Email Leads
42.0%
54.2%
And an average lead value of
$45,675

More capital equipment industry stats
- 8.83% MORE new condition assets listed on the platform than last year
- 39.81% of all enquiries were submitted after hours
- Organic traffic increased by at least 19% across each State and Territory year-on-year
- State of Industry for our top 5 industries
- Forecasting for our top 5 industries
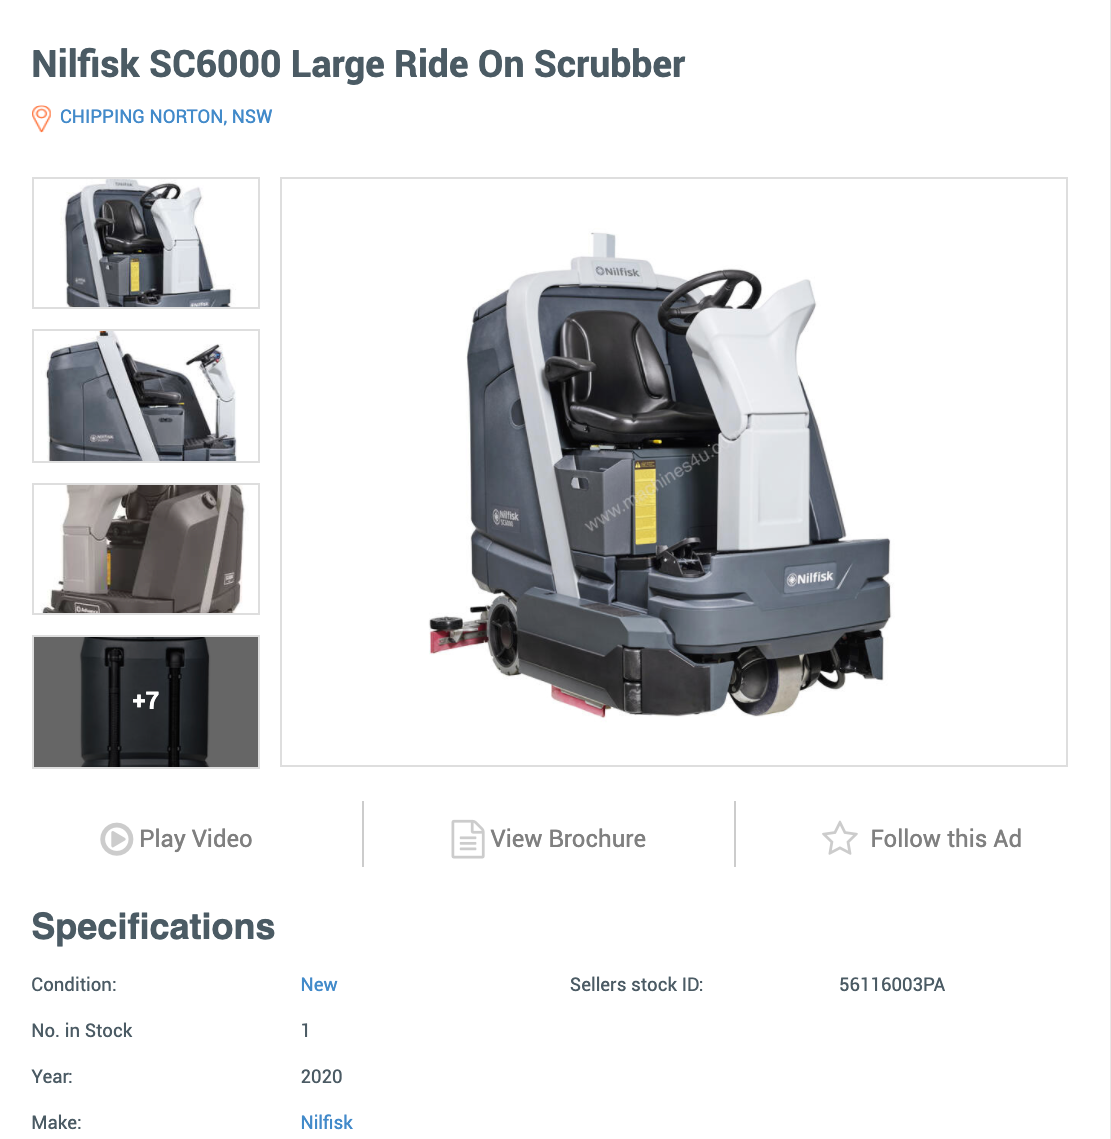
Cleaning Industry
Snapshot
Traffic for Cleaning decreased by
-2%
-0.98%
-10.64%
-3.66%
-5.48%
-1.15%
1.39%
-0.03%
-4.23%
Shivam's
Cleaning industry insights
What was the biggest change in buyer behaviour for Cleaning?
+8.1%
Increase in Email Leads
51.7%
59.8%
And an average lead value of
$18,587

More capital equipment industry stats
- 8.83% MORE new condition assets listed on the platform than last year
- 39.81% of all enquiries were submitted after hours
- Organic traffic increased by at least 19% across each State and Territory year-on-year
- State of Industry for our top 5 industries
- Forecasting for our top 5 industries
Access Industry
Snapshot
Traffic for access increased Australia-wide by more than
29%
33.76%
36.41%
39.33%
29.36%
23.12%
39.01%
27.88%
22.60%
Shivam's
Access industry insights
What was the biggest change in buyer behaviour for Access?
+0.4%
Increase in PDF downloads
14.2%
14.6%
And an average lead value of
$32,858

More capital equipment industry stats
- 8.83% MORE new condition assets listed on the platform than last year
- 39.81% of all enquiries were submitted after hours
- Organic traffic increased by at least 19% across each State and Territory year-on-year
- State of Industry for our top 5 industries
- Forecasting for our top 5 industries
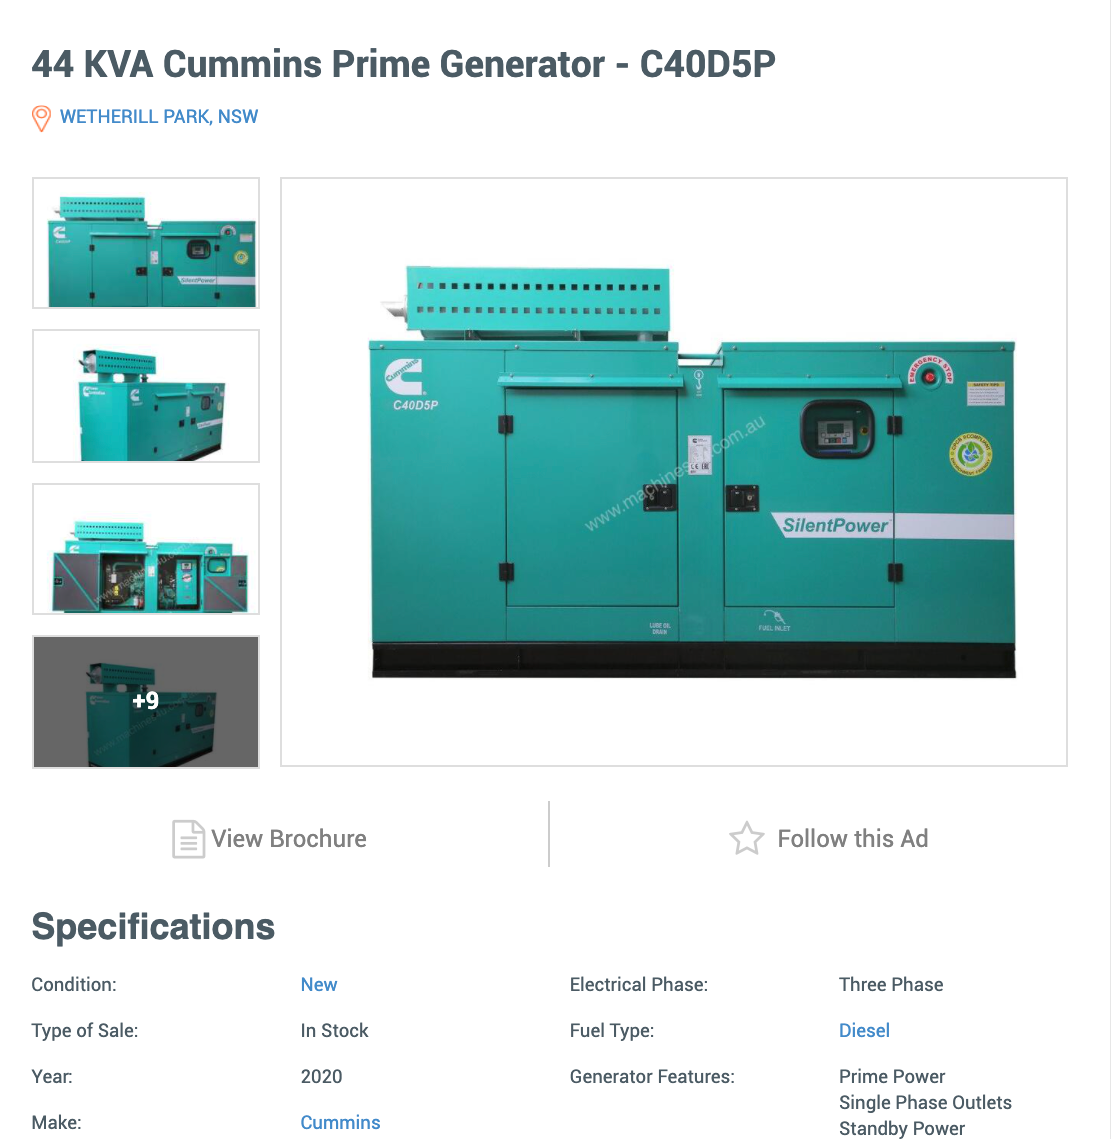
Generator Industry
Snapshot
Traffic for generators increased Australia-wide by more than
24%
24.26%
46.13%
38.18%
15.52%
16.94%
10.08%
22.75%
5.57%
Shivam's
Generator industry insights
What was the biggest change in buyer behaviour for Generators?
+11.9%
Increase in Email Leads
44.6%
56.5%
And an average lead value of
$55,798

More capital equipment industry stats
- 8.83% MORE new condition assets listed on the platform than last year
- 39.81% of all enquiries were submitted after hours
- Organic traffic increased by at least 19% across each State and Territory year-on-year
- State of Industry for our top 5 industries
- Forecasting for our top 5 industries
Workshop Industry
Snapshot
Traffic for workshop increased by more than
5%
12.19%
21.36%
2.50%
14.09%
7.46%
-5.47%
1.61%
-18.55%
Shivam's
Workshop industry insights
What was the biggest change in buyer behaviour for Workshop?
+7.7%
Increase in Email leads
48.3%
56.1%
And an average lead value of
$23,048

More capital equipment industry stats
- 8.83% MORE new condition assets listed on the platform than last year
- 39.81% of all enquiries were submitted after hours
- Organic traffic increased by at least 19% across each State and Territory year-on-year
- State of Industry for our top 5 industries
- Forecasting for our top 5 industries
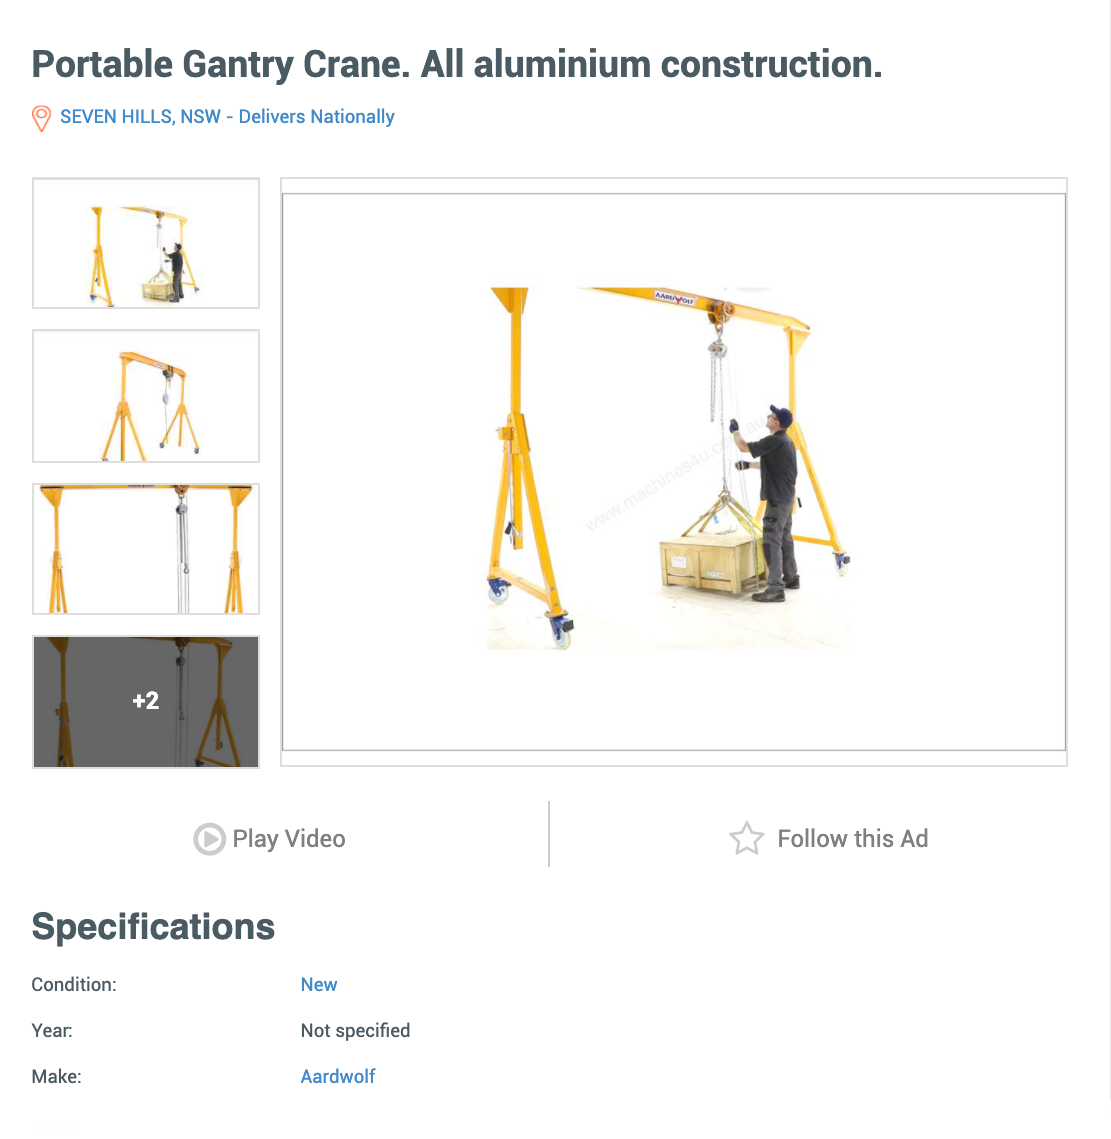
Material Handling Industry
Snapshot
Traffic for material handling increased by more than
11%
23.21%
-13.48%
13.49%
8.24%
8.74%
18.40%
10.77%
-12.42%
Shivam's
Material Handling industry insights
What was the biggest change in buyer behaviour for Material Handling?
+7.8%
Increase in Email Leads
54.9%
62.7%
And an average lead value of
$36,039

More capital equipment industry stats
- 8.83% MORE new condition assets listed on the platform than last year
- 39.81% of all enquiries were submitted after hours
- Organic traffic increased by at least 19% across each State and Territory year-on-year
- State of Industry for our top 5 industries
- Forecasting for our top 5 industries